
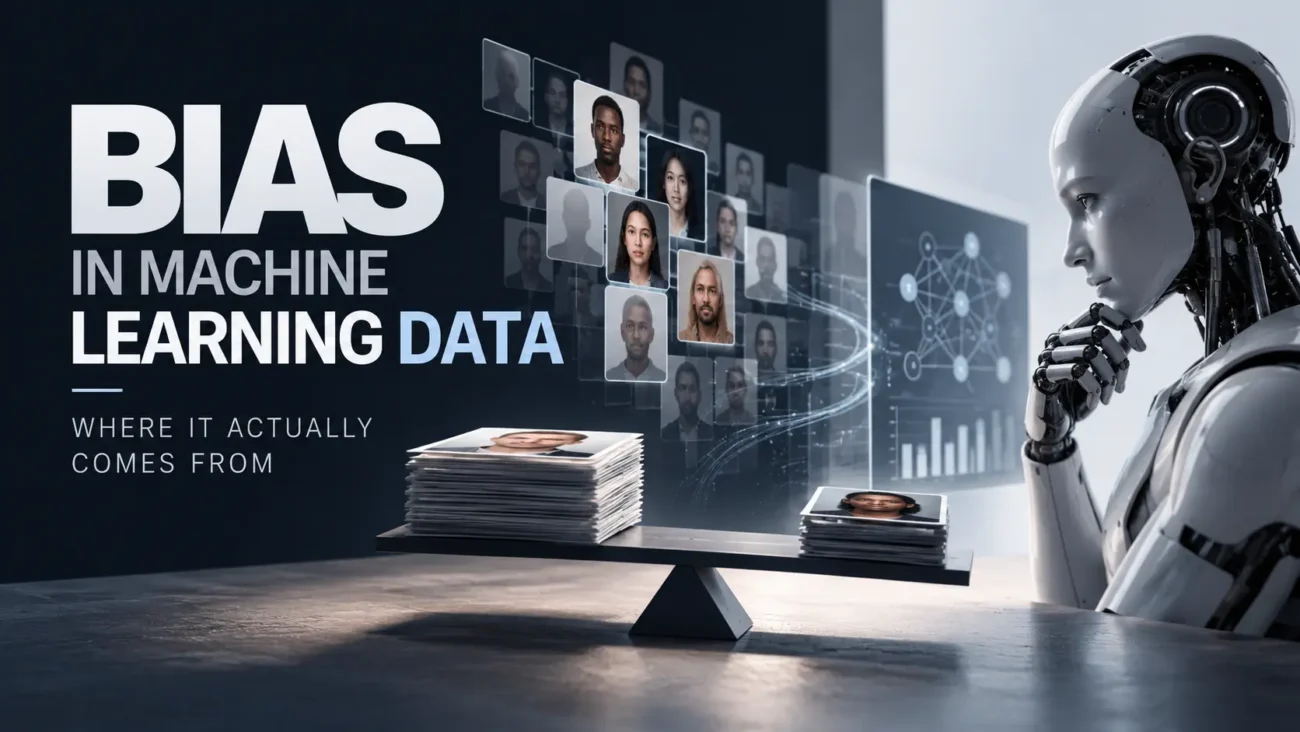
A hospital algorithm used across the United States was built to find patients who needed extra medical attention. It was never given patients’ race. Its inputs were things like age, diagnoses, medications, and past costs. Yet when researchers studied it, they found that at the same risk score, Black patients were considerably sicker than White patients. The reason was what the algorithm had been asked to predict. It predicted health care costs, and less money is spent on Black patients at the same level of need. Cost stood in for illness, and the stand-in was skewed. (Obermeyer et al., Science, 2019)
Nothing in the code was hostile. The problem sat in a design choice and in the data behind it. That is the pattern behind most bias in machine learning data: it enters long before the model makes a prediction. So where does it actually come from?
How Does Bias Enter Machine Learning Data?
Bias enters machine learning data at many points: in the world the data records, in who gets included, in what is measured, in how people label examples, in how data is cleaned and tested, and in how a system is used afterward. A model then learns whatever patterns the data contains, fair or not. Here are the places this article follows, in order:
- The world itself. Data can accurately record an unequal world.
- Who gets included. Some people and places are over- or under-represented.
- What gets measured. Convenient stand-ins (proxies) can distort the picture.
- Who labels the data. The “right answers” come from people and past decisions.
- How data is cleaned. Dropping, filling, and merging records changes who remains.
- How models are tested. A good overall score can hide who the model fails.
- What happens after launch. Use, feedback, and new data can reinforce the problem.
This is a practical way to organize the research, not an official standard. NIST, the U.S. standards agency, groups AI bias into three broader categories: systemic, statistical, and human. The seven places below cut across all three.
Why Training Data Shapes What a Model Learns
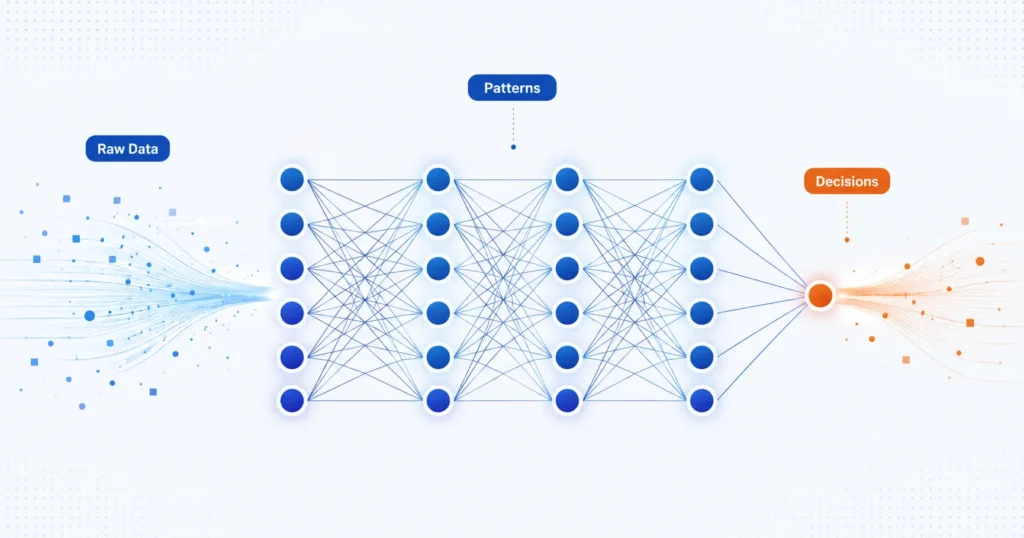
Training data is the set of examples a model learns from. In a typical system, each example pairs some information (a loan application, an X-ray, a resume) with an outcome or label (approved, healthy, hired). The model looks for patterns that connect the two, then applies those patterns to new cases. The catch is that a model has no way to know which patterns are fair, which are accidents, and which are echoes of past mistakes. It learns what is there. If you want a refresher on that basic process, our explainer on how machine learning works covers it step by step.
It is tempting to treat a dataset as a neutral mirror of reality. Researchers at MIT argue it is closer to the product of a long chain of human choices: what to collect, who to include, what to measure, who labels it. That is why “the data is biased” is true but not very useful. The more helpful question is where in the chain the problem entered.
Two meanings of “bias”
The word does double duty in machine learning. In one sense, bias is a statistical idea: a model that is systematically off because of oversimplified assumptions, usually discussed alongside variance. In the other sense, bias means unfair or systematically harmful outcomes for particular groups of people. This article is about the second meaning.
Seven Places Bias Can Enter the Machine Learning Pipeline
Picture the journey in order: the world, then collection, representation, measurement, labeling, cleaning, evaluation, and deployment, with feedback looping back to the start. Each stage involves choices, and each choice can carry a problem forward.

1. The World Itself: Historical Bias
Data can be collected carefully, sampled well, and measured accurately, and still be a problem. That happens when the world it records was itself unequal. MIT researchers Harini Suresh and John Guttag call this historical bias. It arises even when data is perfectly measured and sampled, if the world as it is or was leads to harmful outcomes. Accurate does not mean fair.
Language is a clear case. In a 2017 study in Science, Aylin Caliskan and colleagues showed that a statistical model trained on ordinary web text reproduced well-documented human biases around gender and race. The text contained recoverable imprints of historic biases. Any natural language processing tool built on that kind of text starts from the same record.
This does not make such a dataset worthless. It means the dataset is evidence of what happened, not a guide to what should happen. Past hiring decisions, for instance, show who was hired. They do not show who deserved to be.
What to look for: a system trained to imitate past decisions, with no review of whether those decisions were fair.
2. Who Gets Included: Sampling and Representation Bias
Imagine building a model to spot a skin condition using photos collected mostly from one region. It may work well there and poorly elsewhere, not because of any flaw in the math, but because most of the world never appeared in its examples. That is representation bias. Google’s machine learning course describes selection bias as examples chosen in a way that doesn’t reflect their real-world distribution. It can take several forms: coverage bias (some groups are never reached), non-response bias (some groups don’t participate), and sampling bias (the collection method wasn’t properly random).
A well-known case involves image datasets. In a 2017 Google Brain study, researchers placed the images they could geolocate in ImageNet by country. Around 45% of that sample came from the United States, while China and India accounted for roughly 1% and 2.1%. They also found that classifiers trained on these data handled certain images, such as wedding photos from some countries, much less reliably. Large web-scraped datasets make this hard to catch by hand. Systems built with deep learning often train on millions of examples, which is why who is in the data needs to be checked deliberately rather than assumed.
What to look for: a mismatch between the people in the data and the people the system will serve.
3. What Gets Measured: Proxies and Measurement Bias
A proxy is a measurable stand-in for something you actually care about. You often cannot measure “health need,” “job performance,” or “likelihood of repaying a loan” directly, so you pick something you can measure. The healthcare algorithm from the opening is the textbook case. The developers wanted to find patients with the greatest health needs. They used health care spending as the stand-in. Spending and illness are correlated, which made it look like a reasonable choice, and by some measures of predictive accuracy it worked. But unequal access to care meant less was spent on Black patients at the same level of illness. The algorithm, which excluded race as an input, still produced racial bias, because the label itself carried it.
The fix the researchers tested was a change of label. When they trained a version to predict health outcomes rather than costs, the share of Black patients in the highest-risk group rose substantially. This is why deleting a sensitive column such as race does not necessarily remove bias. Another variable, like cost, can carry the same signal. COMPAS, a criminal-justice risk tool, is often discussed in this context because arrests can serve as a proxy for crime. That example is contested, and we return to it below.
What to look for: a convenient number being used as a stand-in for something harder to measure.
4. Who Labels the Data: Human Judgment and Annotation Bias
In supervised learning, labels are the answers a model learns from. Someone, or some rule, decides them: a doctor’s diagnosis, a manager’s performance rating, a moderator’s call on whether a post is harmful. Those judgments carry human assumptions. Labeling instructions can steer results. Annotators can disagree, and context can matter. In the MIT paper’s illustration, human-assigned suitability ratings in a hiring dataset let a model learn gender discrimination.
The key distinction is between more examples and more examples carrying the same biased labels. In the MIT example, a researcher training a heart-attack model noticed it missed more cases in women. Adding data on women improved it, because the problem was too few examples. A colleague building a resume-screening model saw it score women lower and tried the same fix. Nothing changed, because the ratings that served as labels were the source of the problem, and more data from the same process just repeated it.
What to look for: labels that come from past human decisions, a narrow group of raters, or vague instructions.
5. How Data Is Cleaned: Preprocessing Choices
Raw data is messy, so teams clean it. They remove rows, fill in missing values, merge categories, filter records and transform variables.
Those are reasonable steps, and they are also decisions. Dropping every record with a missing value, for example, can quietly remove groups that are more likely to have gaps. Merging detailed categories into broad ones can erase differences that matter. The MIT paper describes steps like handling missing credit-history values and grouping occupations into broader categories as part of normal data preparation. The evidence here is less developed than for the other stages, so the careful claim is a modest one: cleaning choices can change who remains represented and what information is kept.
What to look for: unexplained gaps, rows dropped without a stated reason, and categories collapsed without discussion of what was lost.
6. How Models Are Tested: Evaluation Bias
A benchmark is a dataset used to score models. That means benchmarks can have the same problems as training data. If the test set looks like the training set, a model can post a strong overall score while failing a group that barely appears in either one. This is evaluation bias. Aggregate numbers hide subgroup failures.
Gender Shades, a 2018 study by Joy Buolamwini and Timnit Gebru, showed this clearly. It examined commercial gender-classification systems, which guess whether a face is male or female. It did not study face identification. The researchers found that two common benchmarks were overwhelmingly composed of lighter-skinned subjects (79.6% and 86.2%). When they tested three commercial systems on a more balanced dataset, error rates reached up to 34.7% for darker-skinned women, versus a maximum of 0.8% for lighter-skinned men. These were results for systems tested in 2018, not a verdict on today’s products.
What to look for: a single overall accuracy number with no breakdown by group.
7. What Happens After Launch: Deployment and Feedback Loops
A system is rarely used exactly as designed. The MIT paper notes that risk-assessment tools in criminal justice have been used in ways beyond their original purpose, such as informing sentence length.
Deployment can also reshape the data. Predictive policing offers a mechanism worth understanding. If a model sends police to the neighborhoods with the most recorded crime, more crime gets recorded there, because that is where officers are looking. That new data feeds the next round of predictions. Researchers Danielle Ensign and colleagues showed that such systems can be susceptible to runaway feedback loops, sending police back to the same areas regardless of the true crime rate. Not every deployed system forms a loop like this. It happens when a system’s outputs influence the data it later learns from.
What to look for: use that differs from the original purpose, and system outputs that become tomorrow’s training data.
Summary: Where Bias Can Enter
| Source of Bias | How It Enters | Simple Example | Possible Impact |
|---|---|---|---|
| Historical | Data records an unequal world | Past hiring decisions used as training signal | Model repeats old patterns |
| Representation | Some groups are missing or thin | Images drawn mostly from a few countries | Worse accuracy for the missing groups |
| Measurement | A proxy replaces the real target | Spending used to stand in for health need | Skewed scores despite no sensitive input |
| Labeling | Labels reflect human judgment | Manager ratings used as “suitability” | Bias baked into the “right answers” |
| Cleaning | Records or categories are dropped or merged | Rows with gaps removed | Some groups shrink or disappear |
| Evaluation | Tests don’t reflect real users | Benchmark dominated by one group | Failures hidden by a good overall score |
| Deployment and feedback | Use and outputs reshape data | Predictions steer where data is collected | Problems reinforced over time |
How Biased Data Changes What a Model Does
Once bias is in the data, it shows up in results. A model may make more errors for some groups than others. It may score or rank people unevenly. It may miss cases it should catch, or flag people it should not, which researchers call false negatives and false positives.
Researchers separate two kinds of harm. Allocative harm is when opportunities or resources are withheld, as in a loan, a job or extra medical care. Representational harm is when a system stereotypes or stigmatizes a group, as when a language tool associates certain jobs with one gender. The same patterns can appear in generative AI, where assumptions in training data can surface in the text or images a system produces.
Biased Data in AI Language Tools
Large language systems learn from enormous collections of text. Those collections reflect how people write, including their assumptions, stereotypes, and historical patterns.
The Caliskan study offers a hint of why this matters. The researchers found biases not only in harmful content but in ordinary text. That suggests removing offensive material helps but cannot, on its own, remove every underlying pattern. A recent peer-reviewed review of bias in language models makes a related point: models inherit biases from their training data, and a system may answer better about regions and languages that are well represented in that data. That is why evaluation matters. Outputs can vary across groups, topics, and languages, and the only way to see it is to test for it.
Real-World Examples of Machine Learning Bias
The healthcare case from the opening is the clearest example of a proxy problem. Here are four more, with a note on how strong the evidence is for each.
Amazon’s experimental recruiting tool (reported by Reuters). In 2018, Reuters reported that a resume-screening engine Amazon had been building since 2014 penalized resumes containing the word “women’s” and downgraded graduates of two all-women’s colleges. According to Reuters, the system had been trained on resumes submitted over a 10-year period, and Amazon edited it to be neutral to those terms. The report relied on people familiar with the project. Amazon declined to comment on the tool’s challenges, and recruiters reportedly looked at its recommendations but did not rely on them alone. It is a reported case, not an independent audit.
Gender Shades (peer-reviewed study). Described above: a 2018 audit of three commercial gender-classification systems, with the largest error rates for darker-skinned women.
NIST’s face-recognition demographic study. In 2019, NIST evaluated 189 algorithms from 99 developers and found demographic differentials in the majority of them. A false positive means the software wrongly matched two different people. For one-to-one matching, false positives were higher for Asian and African American faces than for Caucasian faces in many algorithms, by factors of 10 to 100 depending on the algorithm. Some algorithms developed in Asian countries showed no such large difference. NIST said it did not study what causes the differentials, though its lead author said more diverse training data may be one route to more equitable outcomes. It also stressed that different algorithms perform differently.
Language data (Caliskan et al.). Covered above: a model trained on ordinary web text reproduced known human biases.
A contested case: COMPAS. In 2016, ProPublica analyzed risk scores for more than 7,000 people in Broward County, Florida, and reported the tool falsely flagged Black defendants as future criminals at almost twice the rate of White defendants. The company behind it, Northpointe, disputed the analysis. Part of the disagreement is about which definition of fairness to use, since researchers have noted that not all fairness conditions can be satisfied at once. It is a well-documented controversy, not a settled finding.
Common Myths About Biased Training Data
More data always fixes bias
More data helps when the problem is too few examples, as in the heart-attack model. It does not help when the labels or the target variable are biased. The resume model in the same MIT scenario didn’t improve with more of the same data, because the ratings carried the problem. The fix has to match where the problem entered.
Deleting race or gender removes the bias
Not necessarily. A model can pick up the same information through correlated variables. The healthcare algorithm excluded race and still produced racial disparities, because its cost label carried the signal.
Bias is only in the algorithm
Bias can arise from historical conditions, collection, measurement, labeling, evaluation, and deployment. Modeling choices matter too. The MIT paper describes cases where design decisions, such as training for privacy or building more compact models, can widen performance gaps for underrepresented groups. The honest picture is that data, design, and use all play a part.
High accuracy means the model is fair
A single accuracy figure averages over everyone. If a group is small in the test data, a model can fail it badly and barely move the total. Gender Shades is the standard illustration: a system can look strong in aggregate while performing very differently for particular groups.
The 7 Questions Before You Trust a Dataset
You do not need to write Python to ask good questions about a dataset. Whether you are a manager evaluating a vendor, a student reading a paper, or a developer inheriting someone else’s data, these seven questions follow the same path as the sections above.
Several of these checks are simple. You can compare group representation, look at how much data is missing and for whom, ask how labels were produced, and request error rates by subgroup. None of them requires code, only the habit of asking.
Can Biased Training Data Be Fixed?
Often it can be reduced, but the right response depends on where the problem entered. That is the practical payoff of tracing bias through the pipeline. If the problem is representation, improve who is in the data. If it is measurement, revisit the proxy, as the healthcare researchers did by changing the label. If it is labeling, reassess how labels are created. Document datasets, evaluate groups separately, monitor systems after launch, and watch for feedback loops.
Even with all that, perfect results are not on offer. NIST acknowledges that zero bias risk is not achievable, which makes ongoing checking part of the job. For a broader look at ways to reduce AI bias, including steps beyond the data, that guide is the natural next read.
FAQ’s
It is a pattern or problem in a dataset, or in the process that created it, that leads a model to treat groups unfairly or perform unevenly across them. It can come from who is included, what is measured, how labels are made, and more. It is separate from the statistical meaning of bias used in the bias–variance tradeoff.
The main ones are historical patterns in the data, unrepresentative sampling, poor proxies, biased labels, cleaning choices, unrepresentative tests, and what happens after deployment. This article covers each in turn.
Not automatically. The effect depends on the task, the groups involved, and how the model is tested. NIST’s face-recognition study found that not all algorithms showed the same disparities. Bias can also enter through measurement, evaluation, and deployment, not only the dataset.
Only when the problem is too few examples. If the labels or the target variable are biased, more of the same data can repeat the problem, as in the MIT hiring illustration.
Usually not on its own. Other variables can act as proxies. The healthcare algorithm in this article excluded race and still produced racial disparities through its cost label.
Look at provenance and documentation, compare group representation with the target population, examine how labels were made, check what is missing, and ask for results by subgroup rather than one overall score.
No. Data is a common source, but modeling choices, evaluation practices, and how a system is used all contribute. NIST emphasizes that human and systemic factors matter alongside statistical ones.
The Short Version
Bias can enter before training, during development, during evaluation, and after deployment. To understand bias in a model, you often have to look backward: from the prediction to the data, and from the data to the choices that created it. The next time someone shows you an accurate model, ask who is in the data, what it measures, and who labeled it. For more on how these systems work, browse our wider collection of AI topics.
Sources
- Schwartz, R., Vassilev, A., Greene, K., Perine, L., Burt, A., Hall, P. Towards a Standard for Identifying and Managing Bias in Artificial Intelligence (NIST Special Publication 1270). NIST, March 2022. https://doi.org/10.6028/NIST.SP.1270
- Suresh, H., Guttag, J. A Framework for Understanding Sources of Harm throughout the Machine Learning Life Cycle. EAAMO ’21, 2021. https://arxiv.org/abs/1901.10002
- Obermeyer, Z., Powers, B., Vogeli, C., Mullainathan, S. Dissecting racial bias in an algorithm used to manage the health of populations. Science 366, 447–453, October 25, 2019. https://doi.org/10.1126/science.aax2342
- Buolamwini, J., Gebru, T. Gender Shades: Intersectional Accuracy Disparities in Commercial Gender Classification. Proceedings of Machine Learning Research 81, 2018. https://proceedings.mlr.press/v81/buolamwini18a.html
- Grother, P. et al. Face Recognition Vendor Test (FRVT) Part 3: Demographic Effects (NISTIR 8280). NIST, December 2019. https://doi.org/10.6028/NIST.IR.8280. NIST summary: https://www.nist.gov/news-events/news/2019/12/nist-study-evaluates-effects-race-age-sex-face-recognition-software
- Caliskan, A., Bryson, J. J., Narayanan, A. Semantics derived automatically from language corpora contain human-like biases. Science 356, 183–186, April 14, 2017. https://doi.org/10.1126/science.aal4230
- Shankar, S. et al. No Classification without Representation: Assessing Geodiversity Issues in Open Data Sets for the Developing World. NIPS 2017 Workshop on Machine Learning for the Developing World. https://arxiv.org/abs/1711.08536
- Gebru, T. et al. Datasheets for Datasets. Communications of the ACM 64(12), December 2021. https://arxiv.org/abs/1803.09010
- Ensign, D. et al. Runaway Feedback Loops in Predictive Policing. Proceedings of Machine Learning Research 81, 2018. https://proceedings.mlr.press/v81/ensign18a.html
- Google. Machine Learning Crash Course: Fairness, Types of bias. https://developers.google.com/machine-learning/crash-course/fairness/types-of-bias
- Dastin, J. Amazon scraps secret AI recruiting tool that showed bias against women. Reuters, October 10, 2018. https://www.reuters.com/article/us-amazon-com-jobs-automation-insight/amazon-scraps-secret-ai-recruiting-tool-that-showed-bias-against-women-idUSKCN1MK08G
- Angwin, J., Larson, J., Mattu, S., Kirchner, L. Machine Bias. ProPublica, May 23, 2016. https://www.propublica.org/article/machine-bias-risk-assessments-in-criminal-sentencing
- Bias in Large Language Models: Origin, Evaluation, and Mitigation. Electronics 15(9):1824, 2026. https://doi.org/10.3390/electronics15091824




One thought on “Bias in Machine Learning Data: Where It Actually Comes From”